You have a beautiful, responsive website. Better yet, your visitors love it. Why not – it’s filled with quality content, and it features eye-catching images. You also put effort into incorporating interesting and thought-provoking videos.
Occasionally, however, you hit a bump in the road. That’s when you’re trying to manipulate a huge amount of data. It is not that easy to fit it into a neat-looking, easily-readable table to place on your website.
No matter how hard you try, the resulting table is incomplete or unattractive. Sometimes this huge amount of data just crashes your page when you attempt to load it.
That’s where you’ll find the wpDataTables plugin comes in handy. With this WordPress plugin, you can display any amount of data in a tabular format on your website. You can do so intuitively and interactively.
If you purchase wpDataTables between the 22nd and 29th of August, it’s yours for $22. This is a 50% discount!
Who Has a Use for It?
One of the reasons professionals like wpDataTables is because it doesn’t need a single line of code. Thus, this plugin saves programmers and web designers a ton of time. However, it’s not just for techies.
Anyone faced with a need to organize data in a tabular format will find this WordPress plugin useful.
This would include:
- Small business and eCommerce store owners;
- Human Resource and other workplace administrators;
- Event planners, bloggers, and marketers
What Can You Use WpDataTables For?
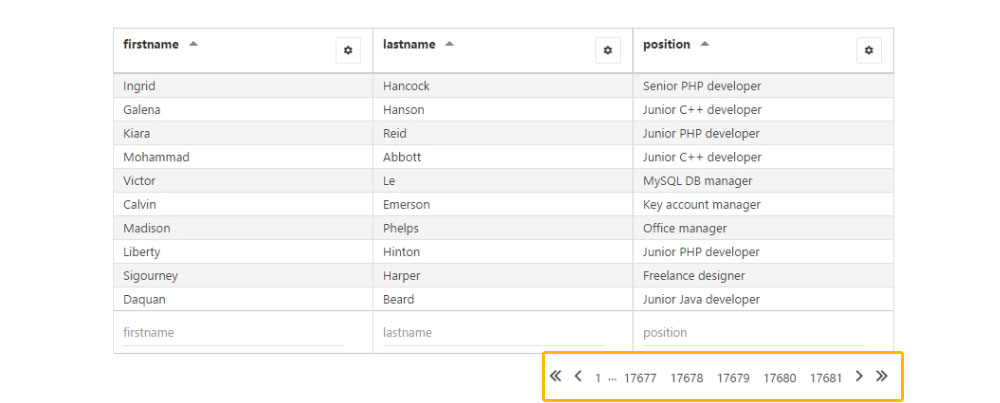
You can use this WordPress table plugin to convert any amount of data into readable tables. This includes millions of rows of data, arranged in hundreds or categories or labels.
Moreover, with this plugin, you can publish responsive and informative tables in WordPress. You can use it for:
- Product and price comparisons, product and services catalogs, price lists, and inventories
- Event rundowns, including sporting events results and statistics
- Progress tracking for businesses and projects, and
- All types of data collection
How to Use This WordPress Table Plugin: Six Simple Steps, plus a Bonus Step
Creating and publishing a responsive data table is easier than you think. All you need to do is follow these simple steps:
Step 1: Save time from the get-go by being prepared
The best way to successfully work your way through any process is to have a plan. In this case, you want to have your data organized to fit into your tables’ structure. If you already have a table in Excel, you’re just a couple of clicks away from a good start.
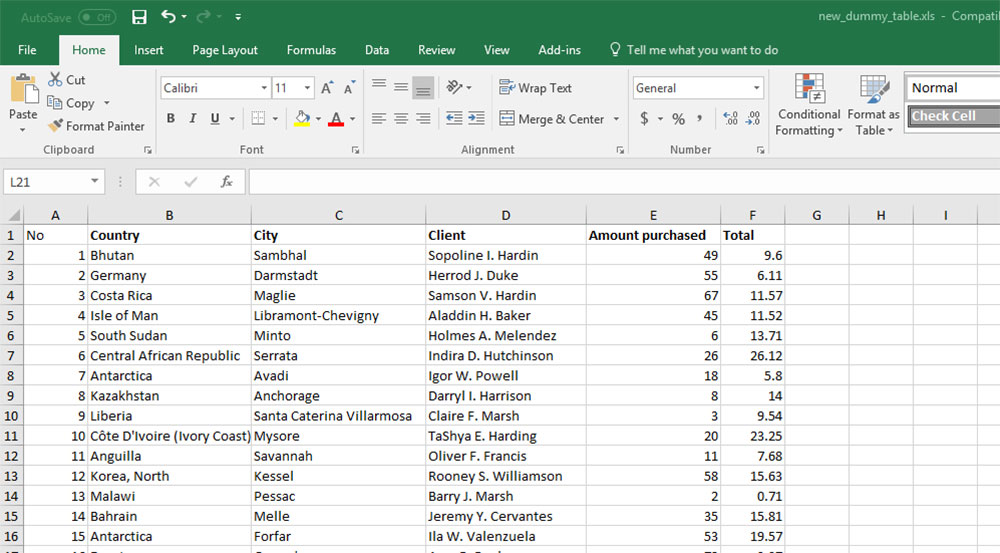
The wpDataTables plugin accepts most any type of data; e.g., Google Spreadsheets, Excel, or MySQL.
Want a PHP array-based table with images for a product catalog? Not a problem with this WordPress table plugin.
Step 2: Adding a new table takes only 2 seconds
Go to the left-hand side of your WordPress dashboard, navigate to wpDataTables. Then click Add New.
Step 3: Now, it’s time to organize your table – down to the minutest detail.
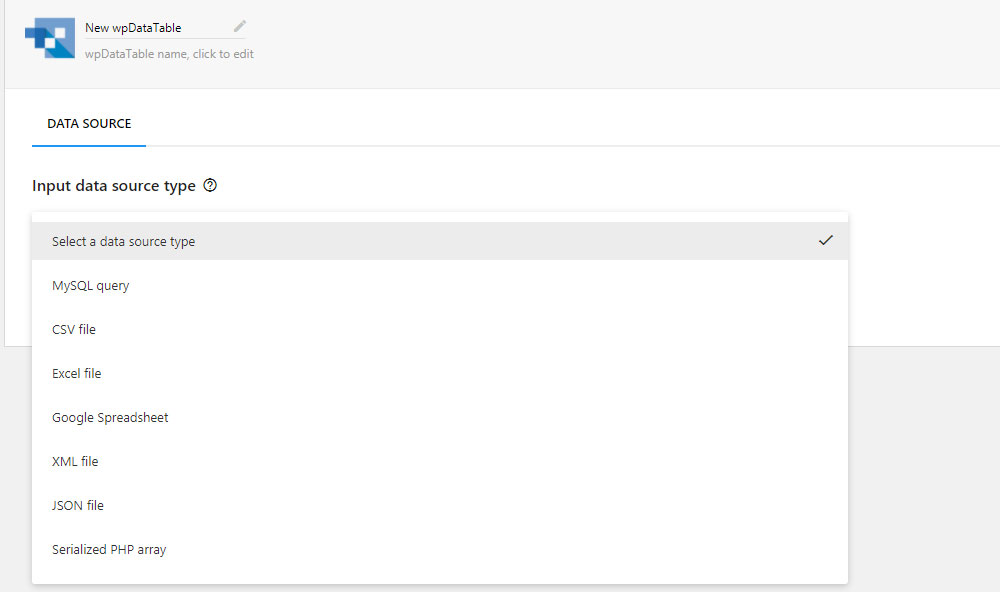
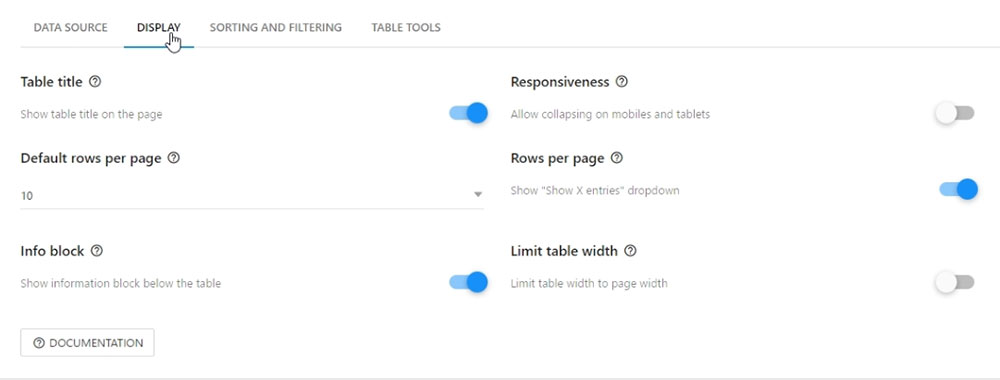
When you click on Add New, a Settings menu will appear; from which you can adjust your new table’s parameters.
Now it’s time to give your table a title. You have the option of making it public, or visible to you alone.
Next step: select your data source. You can choose from Excel, Google Spreadsheet, XML, CSV, JSON, or Serialized PHP Array.
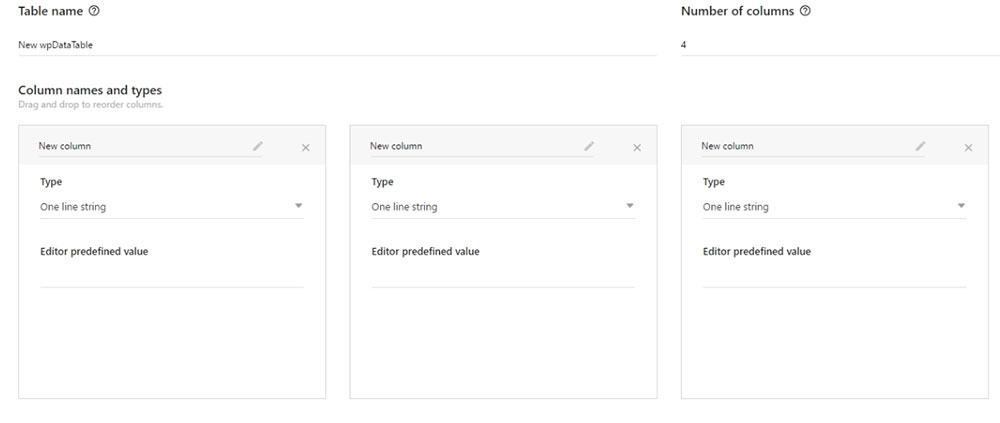
You can also build your table manually with the plugin. This does not require the use of the table source. Feel free to create your table manually in WP Admin with wpDataTables.
Now, you can upload your data file of choice. Don’t be concerned with how massive or complex it might be; wpDataTables can accommodate it.
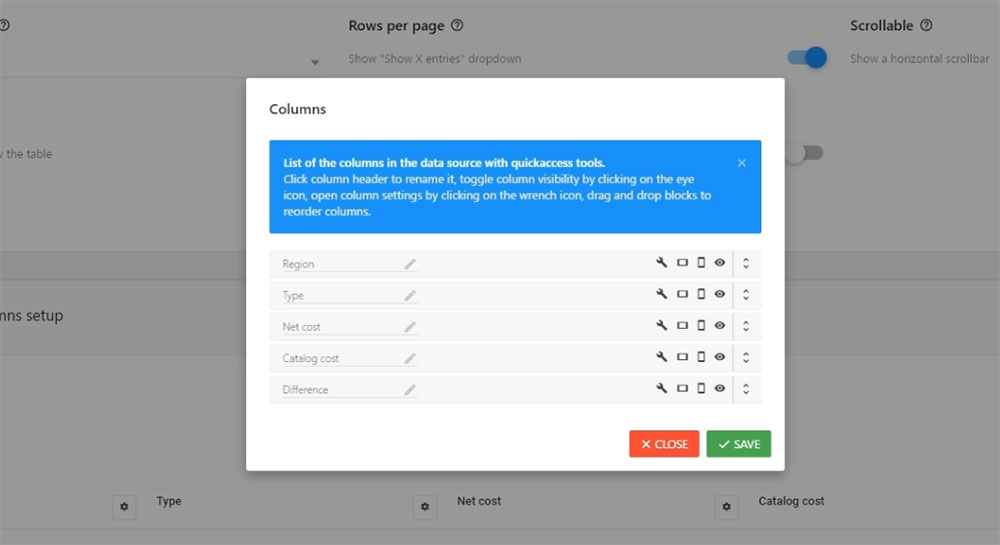
That’s the basics. There are plenty of other useful and interesting features you can work with to make your table just as you want it. Enjoy yourself by taking the time to experiment with them first.
Here’s a sampling of what you can do:
- You can make your table responsive (Responsive feature);
- You can scroll it horizontally (Scrollable feature);
- You can hide it while the page is loading (Hide Table feature);
- Do you want to create a filter below each column or within the form? Use the Advanced Filtering feature, or the Filter in Form feature, respectively;
- The Table Tools and Enable Sorting features lets you copy, save to Excel or CSV, or sort your tables;
- If you want to limit a table’s width, select the Limit Table Layout feature. Also, you can use the Display Length feature to define how many entries you want to display on a page;
- If you need to display the sum of the values in numeric columns, the Sum/Totals Row feature will do the trick.
Step 4: Make your table flat-out immaculate
You can preview your table at any time, including when you’re about to make the final touches. This does not involve having to go back and forth to do so.
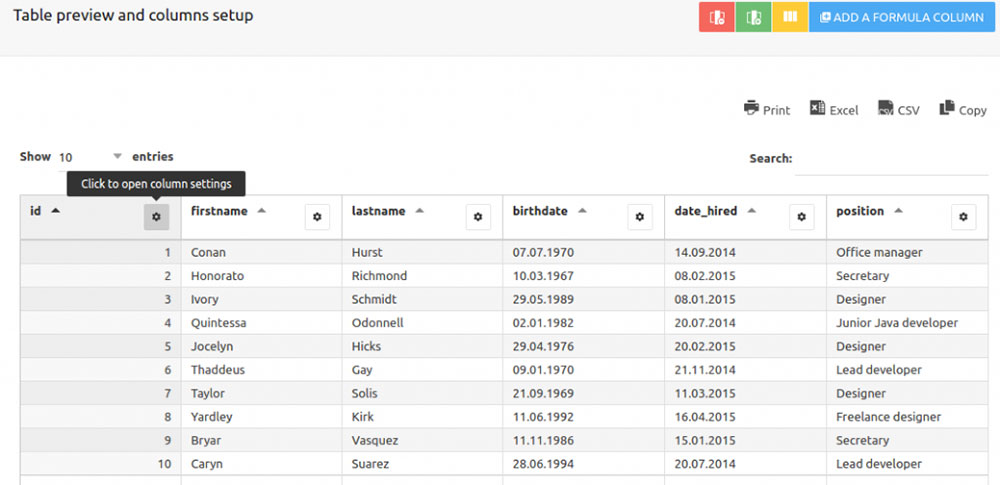
When you’re satisfied with your table’s structure, it is time to address its aesthetics. Work on different colors, color schemes, or font sizes. You can also edit the columns with respect to their type (numbers, text, strings).
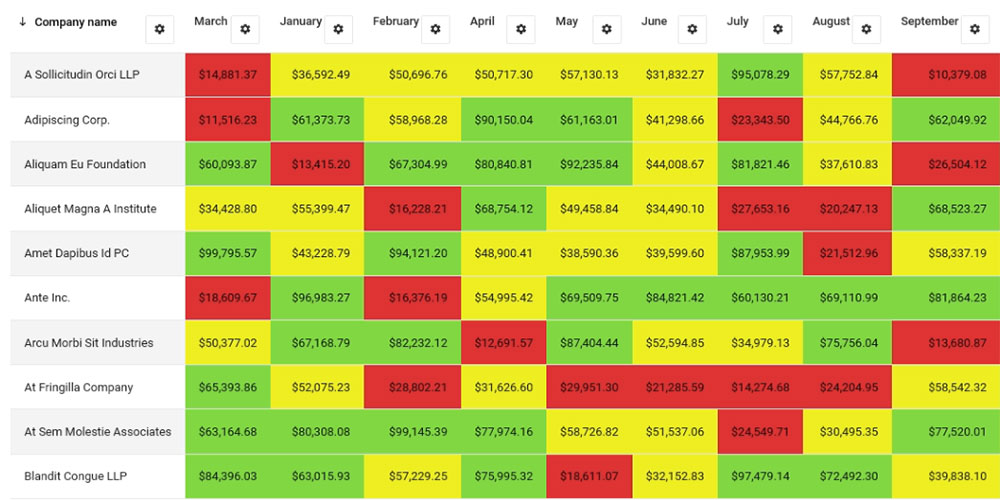
The Conditional Formatting feature is not only useful, but fun to work with. It enables you to highlight rows, columns, or individual cells, based on their content. This is an excellent feature to have available if your table is strictly numerical.
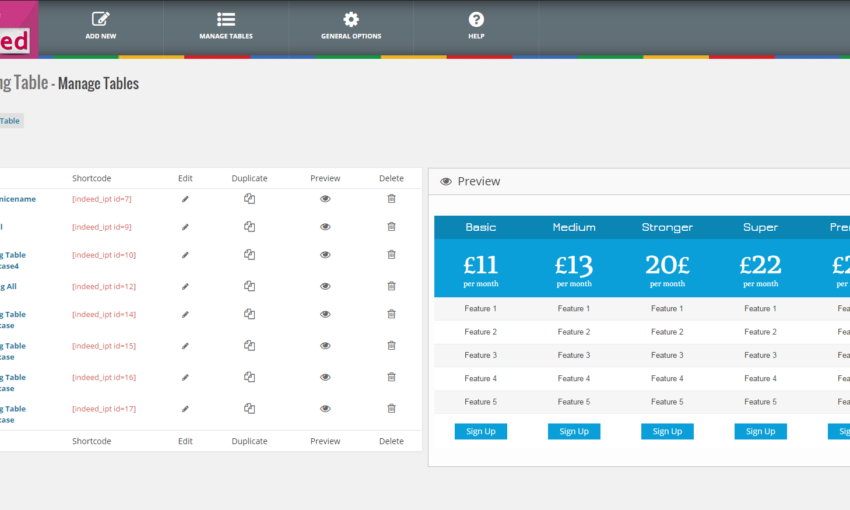
Step 5: Adding a table to a page with a shortcode
When you’re pleased with your table, click Save, and then, Close.
This will take you to the wpDataTables home page. Here you will see your newly-created table, in all its grandeur and ready to publish. You will also be given the shortcode you’ll need to input into your page.
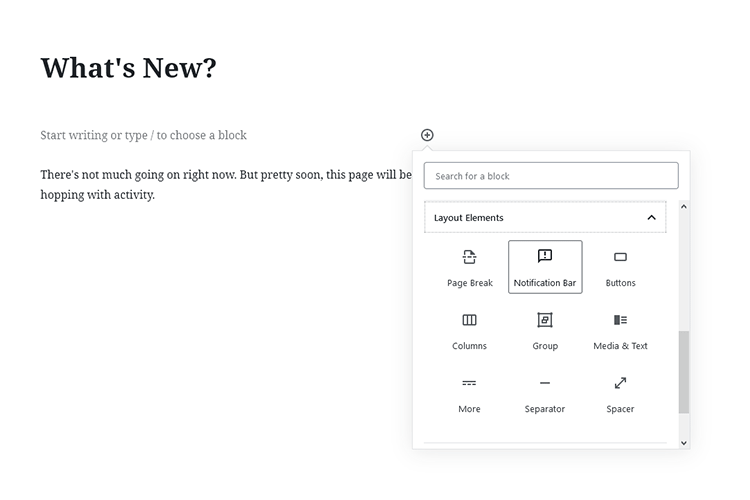
First, copy the shortcode, and then navigate to the page or post the table is to appear on.
Paste the shortcode into the page editor.
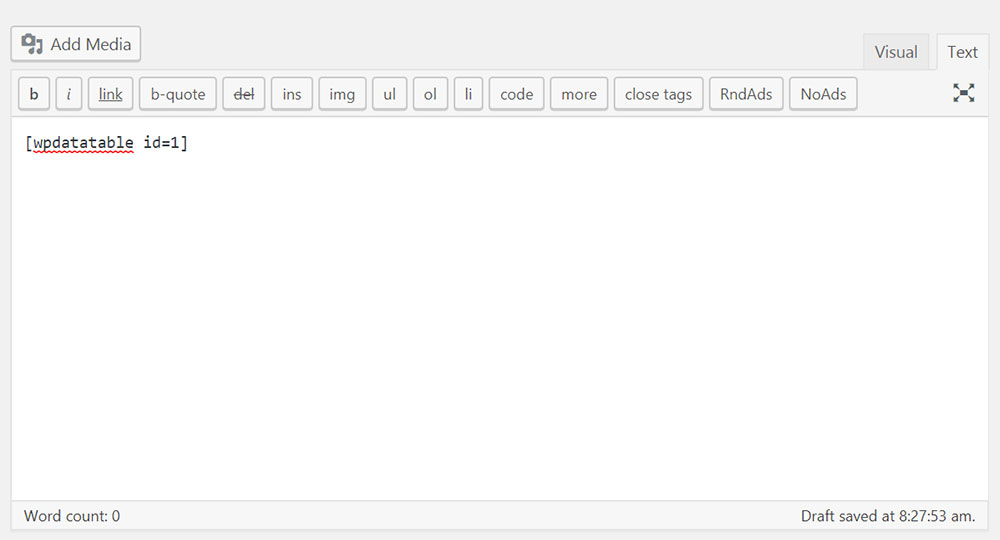
Select the location where you want the table to appear on the page. Usually, this is the location that will allow you to build any needed content around it.
Step 6: Publish your table.
Step 6 is not only the easiest step of all, it’s also the most satisfying.
Click on Publish.
That’s it!
The Bonus Step
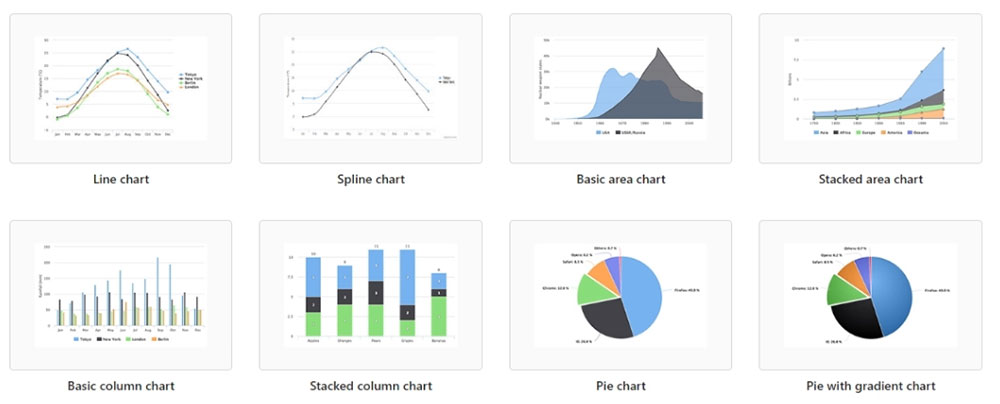
If you want to have a flawless graph or chart on your website, the wpDataChart Wizard enables you to do just that. As is the case with tables, your graphs and charts can also be responsive. They can also be highly interactive and easily editable.
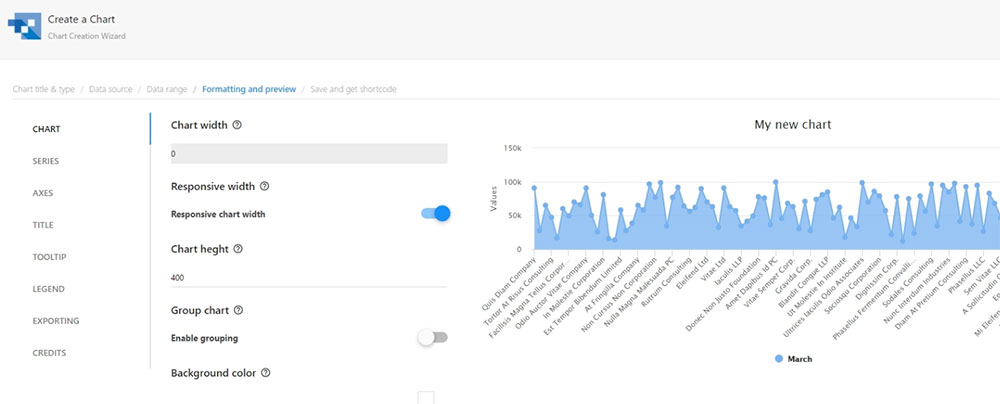
The Wizard can be used with the Google Charts, Highcharts, and Chart.js render engines.
Wrapping it up
There are other features in addition to those mentioned here. They will help you create beautiful, highly-organized, responsive charts in minutes.
With wpDataTables, there’s no more need for struggling to fit massive amounts of data into a small “box”. Another great advantage is that there is no need to write a single line of code!
You can use wpDataTables to manage and present financial and operation statistics. It also allows you to produce large product or services catalogs in a breeze. Moreover, you can feel like a pro performing complex data analysis and comparisons.
Be sure to mark the period between August 22nd and 29th on your calendar. That’s when you can get wpDataTables at a 50% discount.
This post may contain affiliate links. See our disclosure about affiliate links here.